Performance testing using GTmetrix
Table of contents
Overview
It is important to know the performance metrics of your website so that you are in a position to gauge the overall user experience of visitors within your website. This also enlightens you on the required improvements to your website.
There are a number of tools that would be of great help in analyzing your overall website performance. Within this guide we will specifically cover the GTmetrix tool and how to utilize it to carry out tests to your “Stax” theme powered website.
GTmetrix
GTmetrix is an online tool that enables you to analyze the speed and performance of your website.
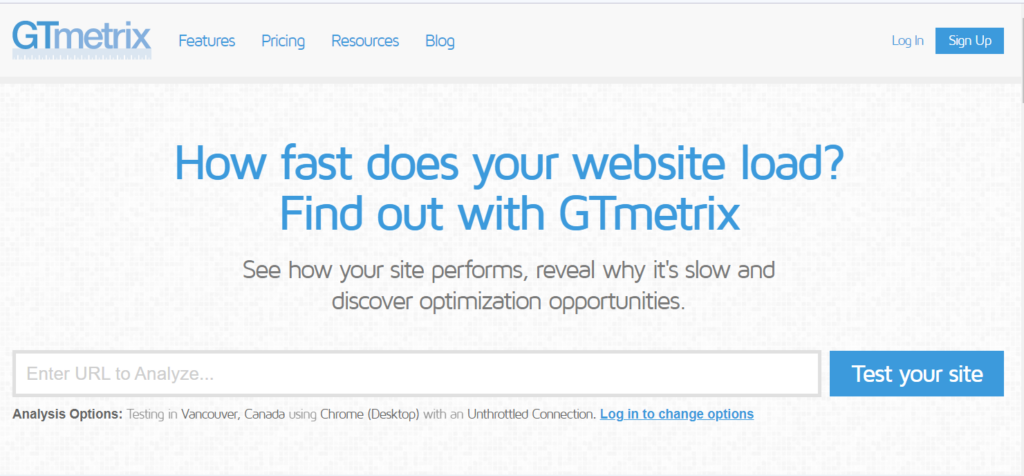
The tool is available under a free and a pro plan as well. In our example here we will be using the free plan. We recommend creating a free account if you do not have one, in order to enjoy extra features while logged in.
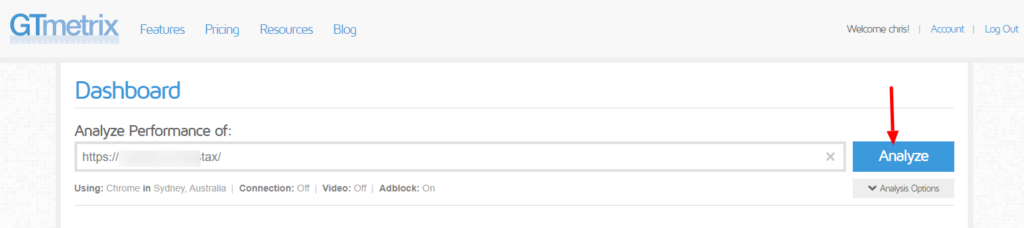
Once logged in, you will be presented with such a view below:
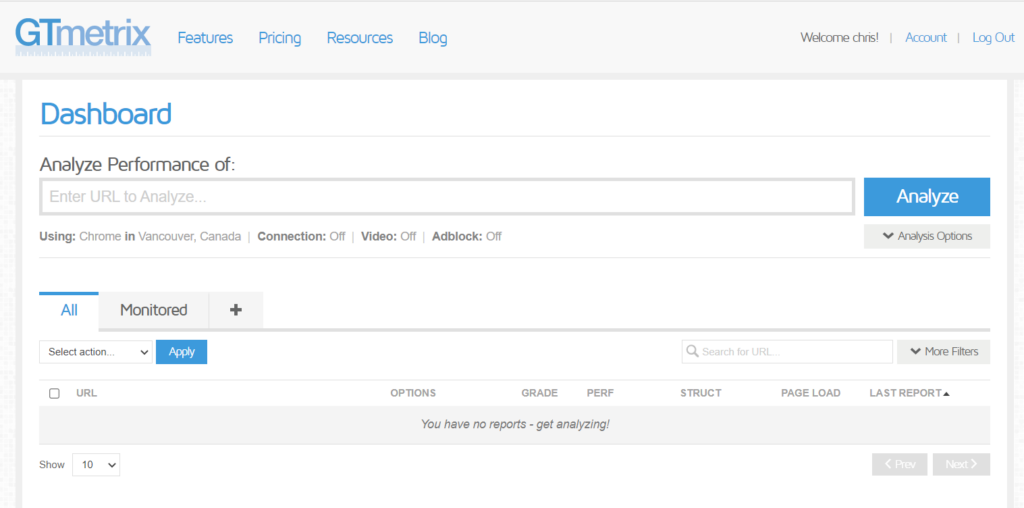
Within the URL field, here you will need to fill in your website address.
Directly below the “Analyze” button, you have an “Analysis Options” dropdown. Click on it and you should be presented with the options illustrated below:
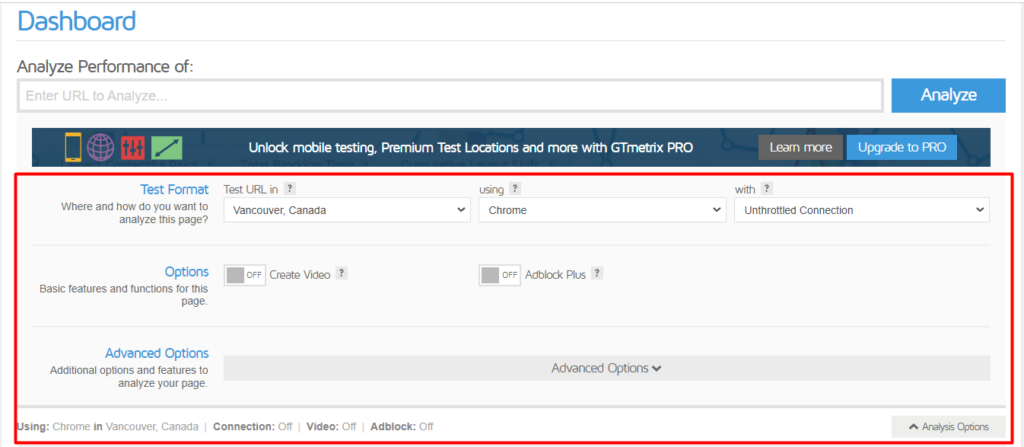
Test Format
Test URL in: Here you can specify your preferred server location upon which to carry out the test. “Vancouver, Canada” is usually the default region when logged in.
Using: Here you can specify the browser to use. The default Browser is usually Chrome.
With: Here you can specify the connection type to be used. The default is “Unthrottled Connection” but you can set any other option provided within the dropdown.
Options
Create Video: When enabled this creates a video that shows how the page loads, and that you can use to debug page load issues.
Adblock Plus: When enabled it disables ads from loading during the test.
Advanced Options
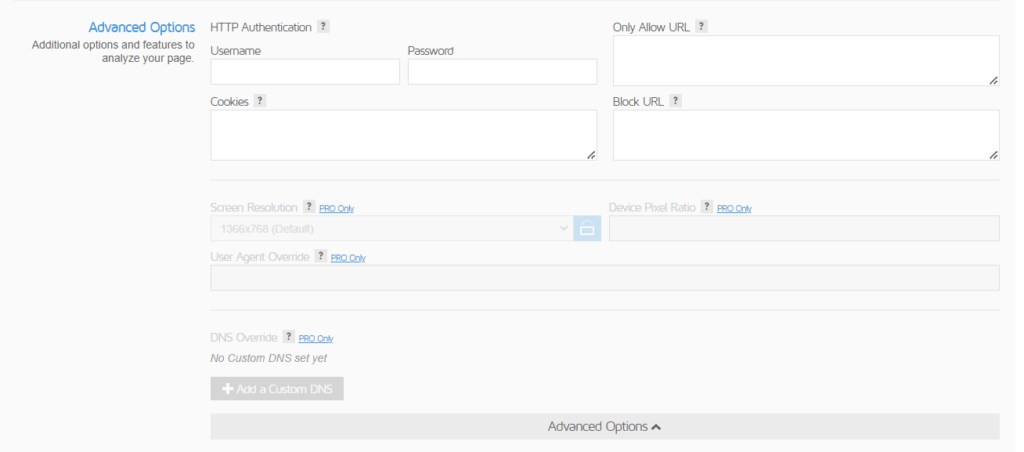
These options are only necessary if you would like to adding features such as HTTP authentication, cookies or if you wish to allow or block certain URLs.
Once you have set up your desired settings, you may then proceed to analyzing your filled in URL by clicking on the “Analyze” button next to the URL field.
Performance Results
Once the test is complete, you will be presented with a report on the performance of your website. Below is a sample report output:
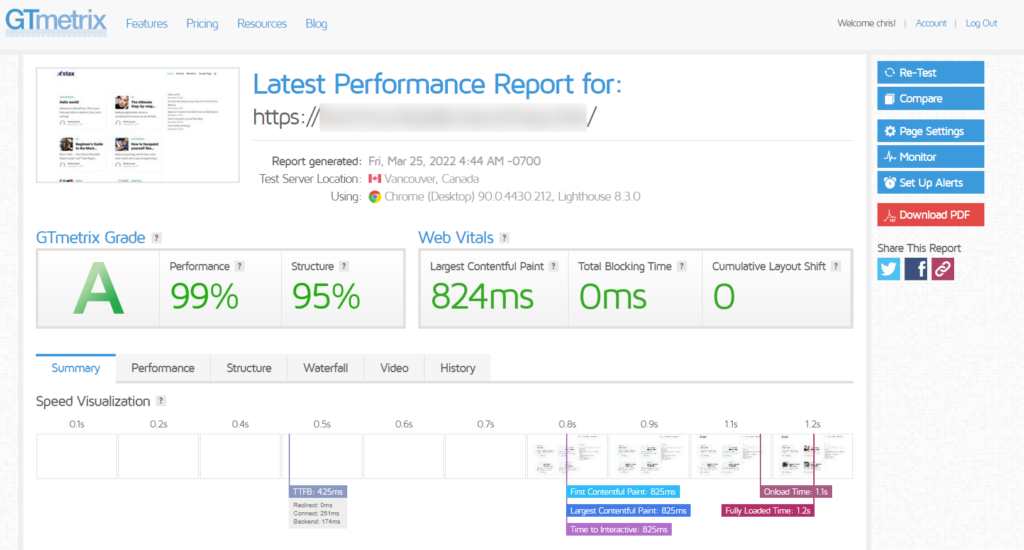
To demystify the report above:
GTmetrix Grade
This is the average graded score of your site performance and structure.
Web Vitals
This returns the performance score of the Google Lighthouse performance metrics.
Below the above sections, we do have some tabs used to exemplify these scores further.
Summary
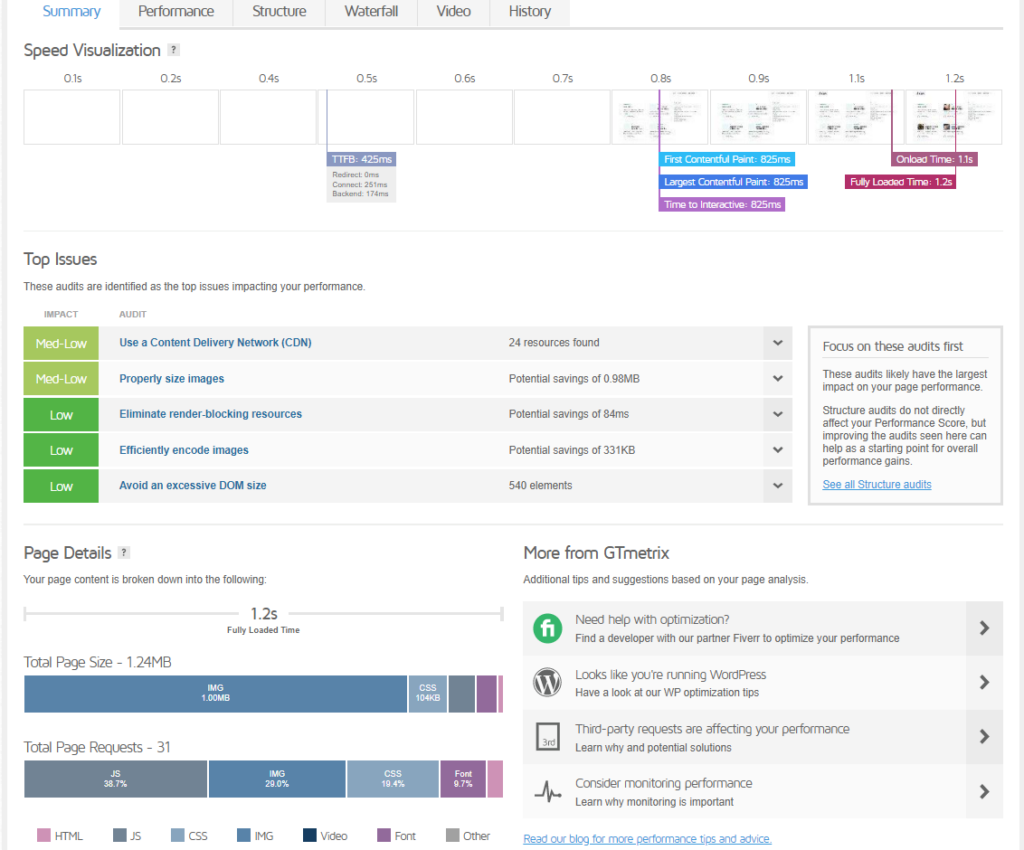
Here, GTmetrix illustrates some of the main aspects of the analysis carried out.
Within the Speed Visualization segment, here we have an overview of how sections within the page are loaded.
The Top issues section highlights the concerns with the highest impact to your page performance. You can work on these highlights to further improve the performance your website. If an issue is resolved, it will no longer be rendered on the list.
On the Page Details section, rendered the pages size of the analyzed page as well as the total number of requests on the page.
The page size consists of files used within the page. These include files such as images, JS files, CSS files and many more that your page could be using.
Requests on the other hand basically refers to what the browser asks for in order to include within the page, such as the files that constitute the page as mentioned above.
Performance
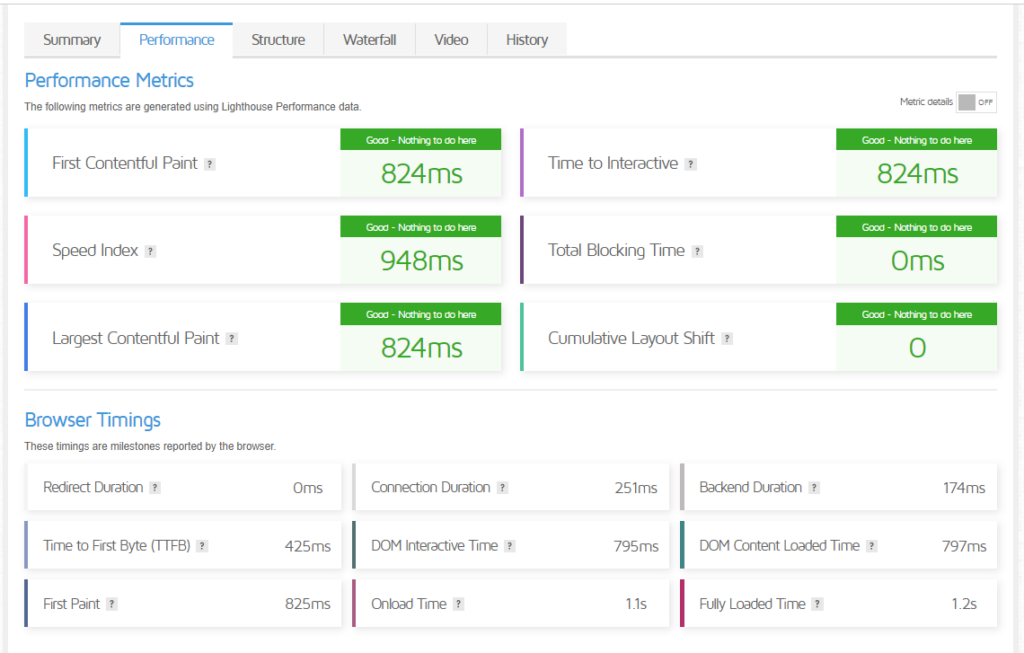
Performance Metrics
Here we see how the six Lighthouse metrics get to perform
First Contentful Paint (FCP): Measures the amount of time it takes for the browser to render the first piece of content within your page. A value between 0 to 1.8 should be good enough.
Speed Index (SI): Returns the amount of time it takes for the visible parts of your page to load and be displayed. A value between 0 to 1.3 should be good to go.
Largest Contentful Paint (LCP): This returns the amount of time it takes to render the largest content visible within your page. A range between 0 to 1.2 would be good.
Time to Interactive(TTI): Returns the amount of time taken before a page is considered fully interactive. A value between 0 to 2.4 would be okay.
Total Blocking Time(TBT): This is the time range within which a page is blocked. Else, this can be defined as the time difference between TTI and FCP (TTI – FCP). A value between 0 and 150 ms would be great.
Cumulative Layout Shift: This is a measure of the page contents movement as the page loads and becomes visible. A score between 0 to 0.1 should be good enough.
Browser Timings
Here we will find a number of other metrics but have no effect to the performance score.
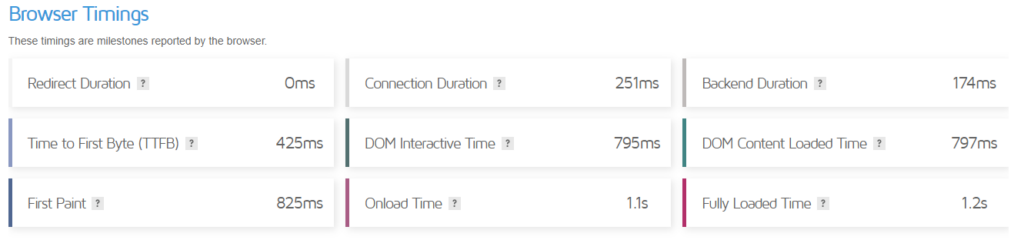
Redirect Duration: This is the amount of time redirects take before loading the final page.
Connection Duration: This is the amount of time the browser takes to connect to the server and access the page.
Backend Duration: This is the time that the server takes to generate a response to the browser.
Time to First Byte: This is the total time that it takes from the initiation of the request to the receiving the first byte of the response. Else this can be perceived as the total to (Redirect Duration + Connection Duration + Backend Duration).
DOM Interactive Time: This represents the time it takes the browser to generate a DOM tree.
DOM Content Load Time: This refers to the time it takes for the DOM to be fully ready.
First Paint: This is the amount of time it takes for the browser to carry out any type of rendering.
Onload Time: This occurs when the full page is processed and resources downloaded.
Fully Loaded Time: This is a measure of when Onload has fired and the network has been idle for 2s.
Structure
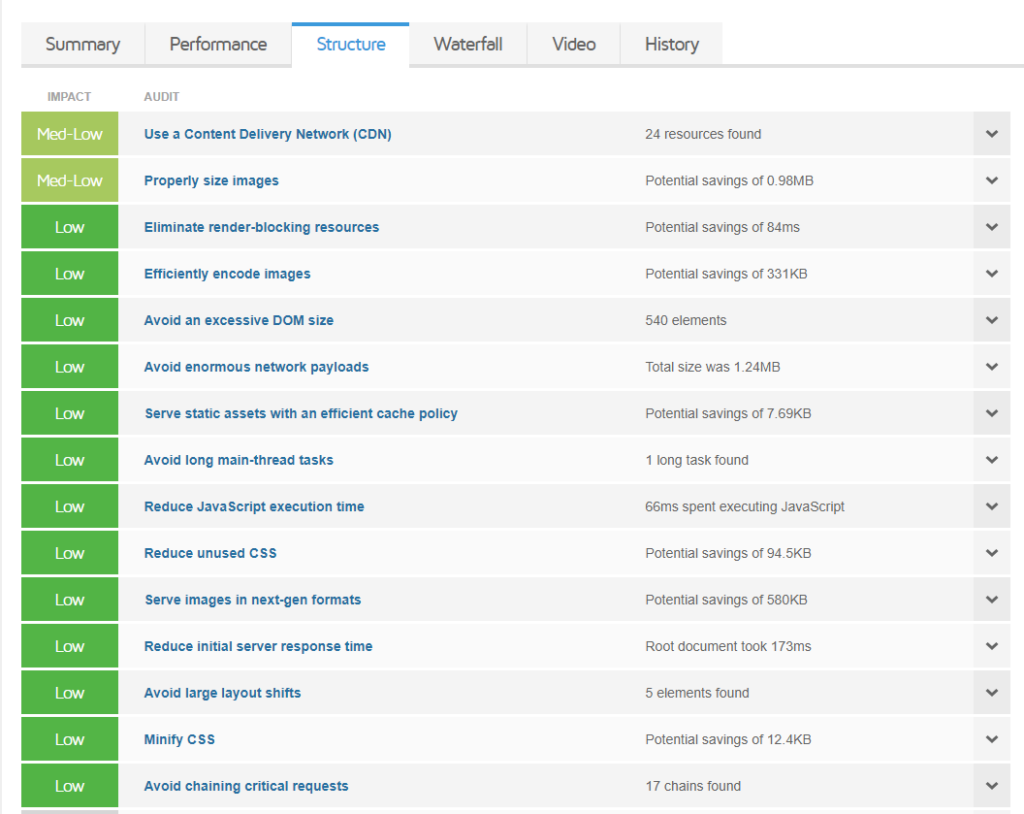
Here we have the recommendations that can be carried out to improve on the performance of the site. You can click on the dropdown within each of them to have a view of the affected elements or resources.
These are the optimizations that you should be keen on carrying out, starting from the higher priority ones. Carrying out the recommended optimizations should provide your site a higher performance score.
Waterfall
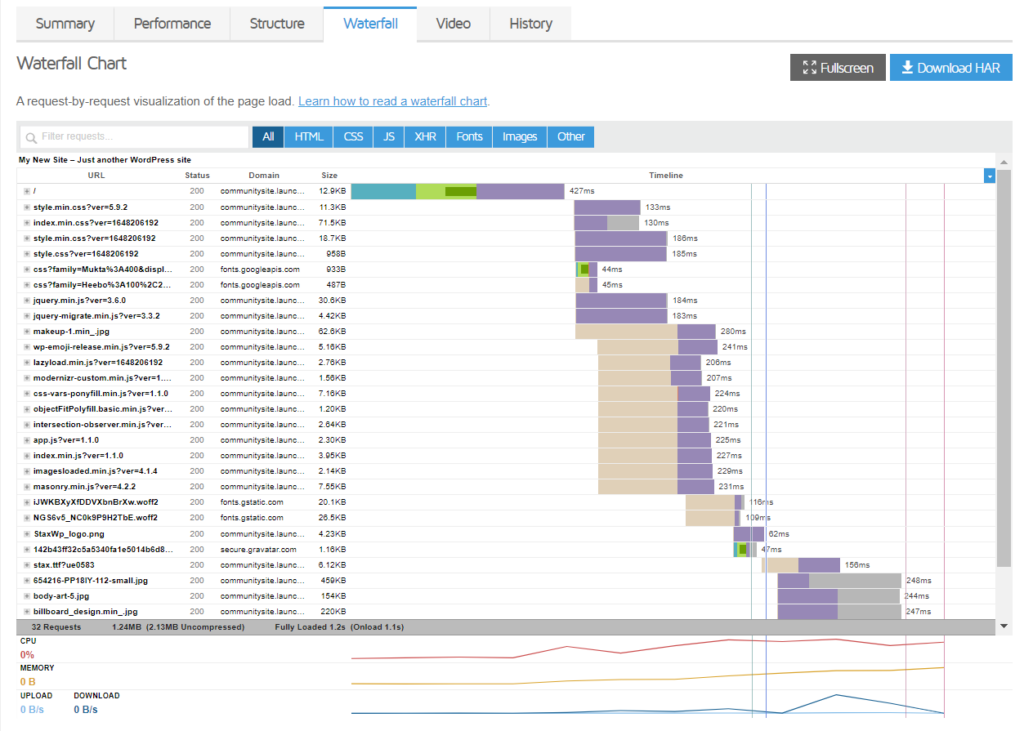
This section displays all requests that are loaded on the page and the order in which they are loaded.
Within this section we can extract information such as which files have a large size and the full load time that they take as well as the status codes returned by the server, on the respective domain URL requests.
Video
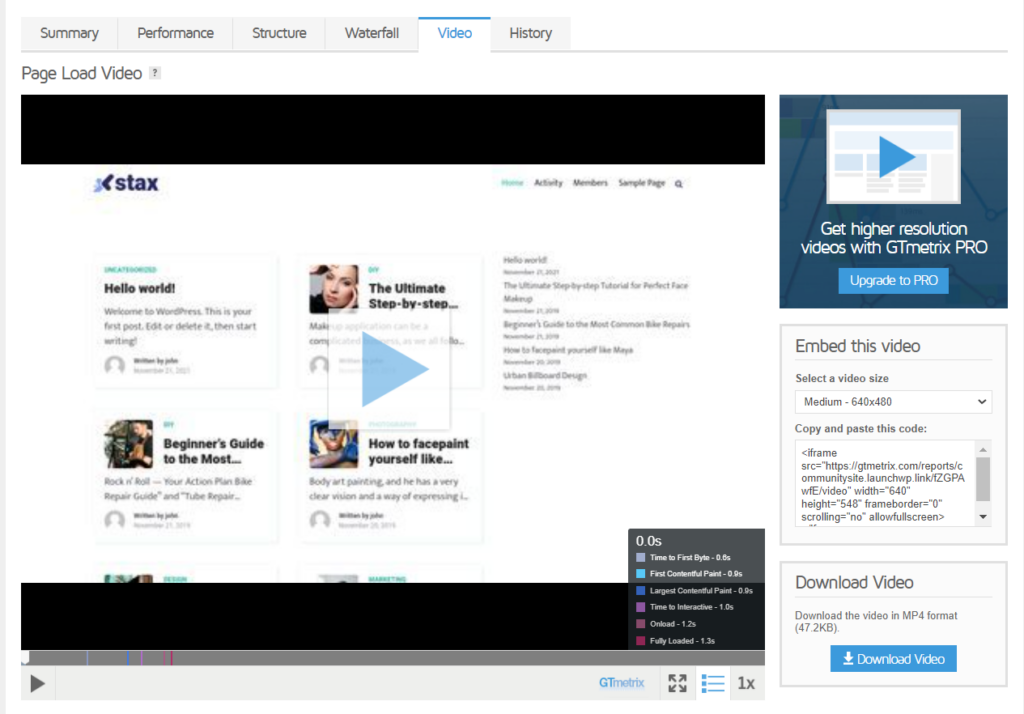
In a case where the “Create Video” option is enabled within the “Analysis options” prior to carrying out the test, a video will be recorded showing how the page loads. This video is what will be rendered within the “Video” tab here.
To the bottom right you will have a view of some of the performance metrics highlighted.
History
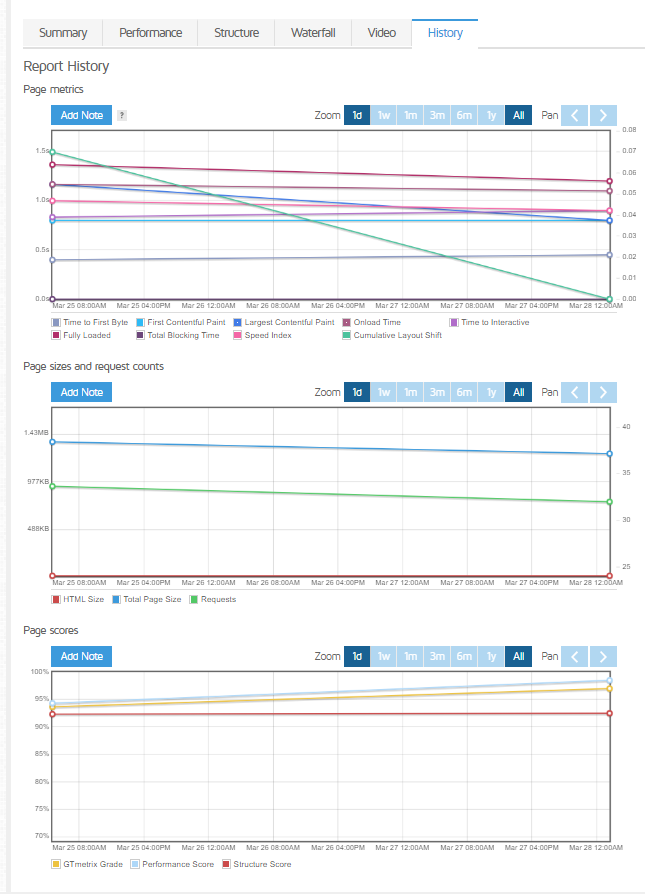
The History tab generates a graphical interface that provides a comparison between at least two tests carried out.
Three graphs are rendered here. These include:
Page Metrics: Provides a comparison of the various performance metrics between two reports. Some of these metrics include Time To First Byte, First Contentful Paint, Largest Contentful Paint, Onload Time, Time to Interactive and many more.
Page sizes and request counts: Generates a comparison between the size of the page and the number of requests made, within the different test reports.
Page scores: Provides a comparison of the scores to the different reports. These comprise of the GTmetrix Grade, Performance Score and Structure Score.
Conclusion
Compared to other Performance testing tools, GTmetrix provides a much clear interface to help you perform a thorough analysis to your website. It is also important to note that scores are calculated differently compared to other tools.